
Welcome! We won’t be talking about math, instead I’ll be showing you how to plot a line in Python.
It sounds hard, but not THAT hard. Unlike linear algebra.
Contents
The Python Program
So first, you’ll have to install a package called  . It lets you plot lines in Python. Once you’re done, then this line of code lets you access it-
import matplotlib.pyplot as pltAfter that, I set some starting values for the x-coordinates, on the x-axis-
import matplotlib.pyplot as plt

x_axis = [-3,-2,-1,0,1,2,3]
y_axis = []
I left the y-axis list blank, because we would need the straight line equation first.
main()
Now, we enter the main subprogram-
def main():
    print("Welcome to the Line Plotter!")
    print("")
    gradient = int(input("Enter gradient: "))
    y_inter = int(input("Enter y-intercept: "))

    equation(x_axis,y_axis,gradient,y_inter)
    plotter(x_axis,y_axis,gradient,y_inter)
    another_line(y_axis)

main()
Line 1 defines the main() subprogram. Line 2 greets the user, and lines 4 and 5 ask for the gradient and y-intercept, respectively.
Lines 7,8 and 9 run the subprograms needed for the code later on. Lastly, line 11 runs the main() subprogram.
equation()
Now, we enter the equation() subprogram-
def equation(x_axis,y_axis,gradient,y_inter):
    y_axis.clear()
    for x in x_axis:
        y = gradient * x + y_inter
        y_axis.append(y)
Line 1 defines the subprogram. Line 2 clears the y_axis array, just in case the user wants to plot another line. Line 3 creates a for loop.
In lines 4 and 5, for each x-coordinate in the x_axis array, the respective y-coordinate is created and added into the y_axis array. (i dont know how to explain this)
plotter()
Next is the plotter() subprogram-
def plotter(x_axis,y_axis,gradient,y_inter):
    line_name = "gradient = " + str(gradient) + "," + " y-intercept = " + str(y_inter)
    plt.plot(x_axis,y_axis, label = line_name)
    plt.title('yes')
    plt.xlabel('x')
    plt.ylabel('y')
    plt.legend()
Line 1 defines the subprogram, and passes in the variables needed. Line 2 labels and differentiates the line. Then, line 3 plots the line.
Line 4 displays the title, and lines 5 and 6 mark  and
and  on the graph. Then, line 7 displays an area describing the elements of the graph.
another_line()
Next, there’s the another_line() subprogram-
def another_line(y_axis):
    confirm_another = input("Would you like to plot another line?: ").lower()
    print("")
    if confirm_another == "yes":
        main()
    else:
        plt.show()
As always, the first line defines the subprogram. Then, line 2 asks if the user wants to plot another line, and sets their answer in lowercase.
Line 4 is an if statement, and line 5 runs the main() subprogram again if the user enters ‘yes’. If not, line 7 displays the graph, the final result.
The Whole Code
This is the whole code-
import matplotlib.pyplot as plt

x_axis = [-3,-2,-1,0,1,2,3]
y_axis = []

def plotter(x_axis,y_axis,gradient,y_inter):
    line_name = "gradient = " + str(gradient) + "," + " y-intercept = " + str(y_inter)
    plt.plot(x_axis,y_axis, label = line_name)
    plt.title('yes')
    plt.xlabel('x')
    plt.ylabel('y')
    plt.legend()

def equation(x_axis,y_axis,gradient,y_inter):
    y_axis.clear()
    for x in x_axis:
        y = gradient * x + y_inter
        y_axis.append(y)

def another_line(y_axis):
    confirm_another = input("Would you like to plot another line?: ").lower()
    print("")
    if confirm_another == "yes":
        main()
    else:
        plt.show()

def main():
    print("Welcome to the Line Plotter!")
    print("")
    gradient = int(input("Enter gradient: "))
    y_inter = int(input("Enter y-intercept: "))

    equation(x_axis,y_axis,gradient,y_inter)
    plotter(x_axis,y_axis,gradient,y_inter)
    another_line(y_axis)

main()
Results
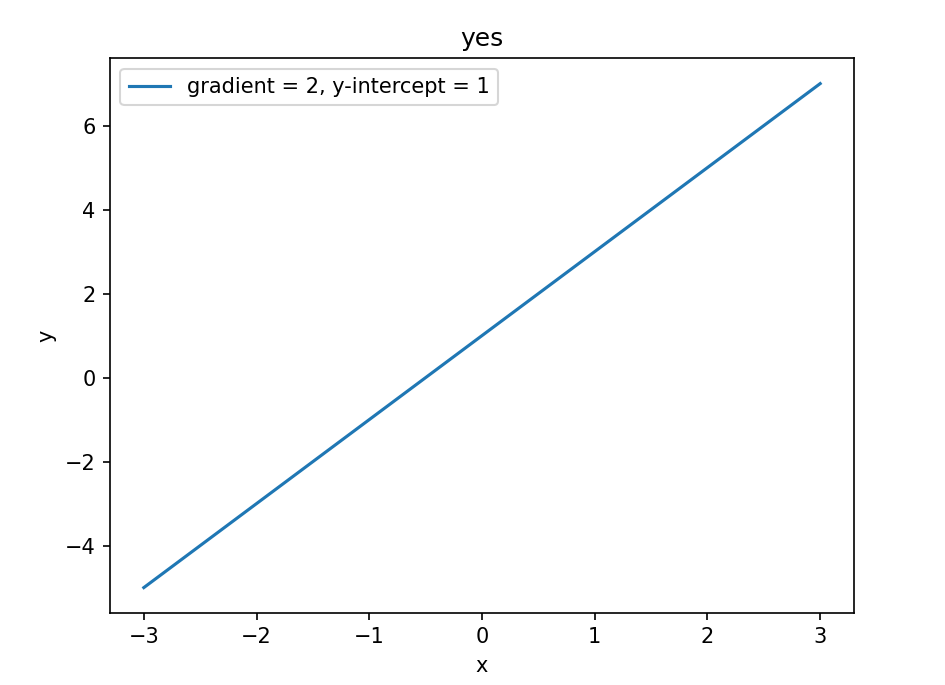
And this is an example of a line plotted by the computer, using the equation  –
–
And this is how it looks when you choose to plot TWO lines-
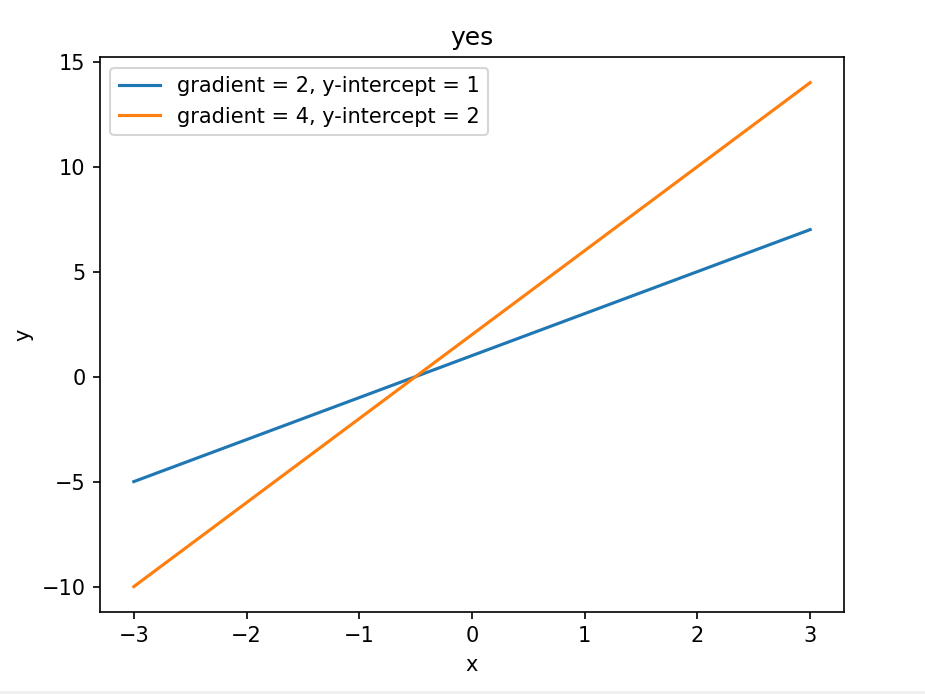
I didn’t know how to make the x-axis and the y-axis appear, so it looks a bit confusing. You can definitely try, though!
Conclusion
This is all for Linear Algebra 101! I hope it was helpful.
I’ll probably be starting new projects in the future, if I’m not so busy. Goodbye!